ABSTRACT
Current
technology makes it feasible to bring large amounts of information to bear in
computer applications. There is a
problem presenting this information to users, because computer displays are too
small to hold it and because the user can only attend to a limited amount of
information at a time. The display of
hierarchical trees is a case in point.
Focus + context methods, such as fisheye trees or cone trees abet this
problem by making visible a dynamically changing subset of nodes of the tree
according to the system’s model of the user’s degree of interest in the
nodes. But such methods are not
constrained to stay within a bounded area.
They may not therefore be guaranteed to fit on a display or behave well
as interface components, such as an overview.
This paper proposes Degree-of-Interest trees. These trees use degree-of-interest calculations and focus+context visualization
methods, together with bounding constraints, to fit within pre-established
bounds. The method is an instance of an emerging
“attention-reactive” information user interfaces
whose components are designed to snap together in bounded spaces.
Keywords
Degree-of-Interest Trees, DOI Trees, focus + context, information visualization, attention-reactive user interfaces, fisheye displays, hierarchical display, tree
INTRODUCTION
Current technology makes it feasible to bring increasingly large amounts of information to bear in computer applications. This is particularly true for applications that involve sensemaking (S. K. Card, Mackinlay, & Shneiderman, 1999; Russell, Stefik, Pirolli, & Card, 1993), ranging from business intelligence to shopping. Limiting factors in the user interfaces for these applications are the related problems of (1) how to assist the user in allocating the user’s limited attention across the large expanse of information and (2) how to communicate and interact with this information through the small expanse of a display. Although the amounts of information involved are getting larger, there are practical limits on making displays larger; in fact, it would often be useful to make them smaller.
This paper explores one instance of a general strategy for constructing such interfaces. The strategy is the Attention-reactive User Interface (AUI). Such an interface consists of two parts. One part is a method for continuous prediction of the user’s instantaneous Degree-of-Interest (DOI) over items in the field of information. The other part is a dynamic visual display of the information that uses the DOI calculation to reduce the time cost of information access or to manage attention. For example, DOI calculations could be used to allocate display resources, decide which elements to display, change representation, highlight, or take initiative in a mixed-initiative dialogue (see Figure 1).

Figure 1. Attention-Reactive User Interface.
The instance of this paradigm we explore here is a method for dynamically interacting with hierarchical information. Hierarchical displays are important not only because many interesting collections of information, such as organization charts or taxonomies, are hierarchical in form, but also because important collections of information, such as Websites, are approximately hierarchical. Whereas practical methods exist for displaying trees up to several thousand nodes, no good methods exist for displaying general graphs of this size. Hence, tree-based displays are more important than just as displays of hierarchical data.
Good visualizations of hierarchical information would (1) allow adequate space at the nodes so that the information at the nodes could be accessed directly, (2) allow users to understand the relationship of an element to its surrounding context, (3) allow users to find elements in the hierarchy quickly, and (3) fit into a bounded region. This last requirement is desirable in order to insure information fits on a display or that it can compose together with other display elements in an application without the need for scrolling.
For purpose of illustration, we shall use the display of organization charts as our example of hierarchical data, keeping in mind that the same techniques work for many different types of trees. Organization charts are trees (at least the ones we shall discuss first are) and have nodes that display several properties per node.
Previous Work
There is a considerable literature on the use of trees for information visualization and on the layout of trees. The algorithms of tree layout from a graph drawing point of view have been summarized in Battista, et al (1999). Forms of trees from an information design and information visualization point of view have been surveyed in (Bertin, 1967/1983), (S. K. Card et al., 1999), and (Herman, Melancon, & Marshall, 2000).
Simple Static Layouts
Much work on tree layouts assume trees will
be static and concentrates on methods to layout trees that meet
aesthetic criteria such as minimal line crossings, placing nodes at the same
tree depth at the same level, and compactness.
The simplest way to lay out trees is to lay them out uniformly
(see Figure 2). The number of nodes at the leaves of all the
subtrees is computed and multiplied by an amount of space per node plus spacing
between nodes and between subtrees.
Then the nodes are scaled so that this fits across the display. This method works for small trees, but any
attempt to portray a tree of moderate size, say 1000 nodes, scaled to the width
of a display will have an extreme aspect ratio to the extent is will start to
approximate the appearance of a horizontal line, since the width increases
exponentially while the height increases only linearly. One way to attempt to gain more space is to
lay trees out circularly, each level in the tree being located on a ring with
greater radius (see (Bertin, 1967/1983) for a catalogue of
examples). This method works best when
the nodes are small marks without content; otherwise, the positioning of text
or images in the nodes interferes with the layout.
![]()
Figure 2. Small tree of 341 nodes, uniformly laid out.
Compressed Static Layouts
More sophisticated methods of tree layouts have been developed that are spatially compact, sliding portions of deeper subtrees underneath shallow subtrees. For example, the classic tree layout method, the Reingold-Tilford layout (Reingold & Tilford, 1981) and its later refinements, creates a top-down, reasonably compact tree that satisfies various aesthetic criteria, such as symmetry and the same shape of common subtrees. Tree space can also be compressed by the use of recursive tree layout algorithms. For example, H-trees lay out the first few branches as an H with later branches forming an H off those. Ball-trees layout the branches as spokes from a root with later branches as spokes from the tips of these (see [Herman, 2000 #21).
Containment Trees
The tree layout algorithms discussed so far use node and link diagrams to represent trees. Trees have also been represented by containment, for example, as a set of nested circles. One class of particularly interesting containment trees are Tree-maps (Johnson & Shneiderman, 1991). A tree-map is a technique in which lower subtrees are contained within higher nodes of the tree. Space is divided, say vertically, into a number of sections equal to the number of branches. Each section is then divided horizontally according to the number of branches at the next level down in the tree. Division of the space continues vertically and horizontally until it is too small to divide. Since the tree does not allow room for the content of non-terminal nodes, the technique can be modified so that each division has extra space for node contents. One advantage of Tree-maps is that they stay within predetermined space bounds, but there is little room for node content, especially of non-terminal nodes, and aspect ratios of the nodes vary widely, obscuring simple relationships Recent attempts to order or squarify the visualizations (Shneiderman & Wattenberg, 2001) have attempted to mitigate this effect.
Interactive Tree Layouts
The techniques discussed so far share several problems for use as components of information visualization systems. First, they do not scale sufficiently. The tree in Figure 2 has only 341 nodes, but is already nearly unreadable. Even using one of the compressed tree layouts will not adequately extend the number of nodes that can be handled. Second, much of the literature on tree layouts does not consider trees in which the nodes themselves contain significant information and require a significant amount of the layout space. If we were to apply these algorithms to trees whose nodes contain typical organization chart nodes, then the layouts would be able to handle many fewer nodes. Third, many of the techniques for tree layout are not bounded in space. They can therefore not be used easily as modular components of information displays. Of course, trees can always just be directly scaled to fit into some space, but doing so for large trees usually makes them unusable. Interactive trees handle the first two of these problems by displaying only a portion of the nodes at one time. In this way, there need not be space for all nodes at the same time and those visible are nodes more interesting to the user. One such technique was introduced in NLS (Engelbart & English, 1968). The user indicates the higher and lower level numbers of the tree to be expanded. The NLS technique allows the user to look horizontally across a slice of tree structure. For example, a user might look at all the procedure call and variable declarations in a program, while suppressing the code itself, which resides at lower levels in the tree. The limitation of the technique is that the user only sees a fragment of the tree and there is no guarantee the tree will all fit on the display. Another interactive technique is used in the user interface of the Apple Hierarchical Filing System. Each level in the tree can be expanded individually by clicking on a small triangle to the left of the level. Thus the user can expand portions of the tree that are to be compared on the screen, while keeping other portions of the tree compressed by eliding nodes below the compressed subtree root. The tradeoffs are that considerable manual manipulation must be performed by the user to constantly adjust views, and there is no guarantee the tree will fit, leading to more manual manipulation of scroll bars. Since the user cannot see large portions of a large tree, the user may have a difficult time navigating the tree or understanding the larger shape of the tree. Static tree layouts can be used as the basis of interactive layouts if they compute quickly enough.
Focus+Context Trees
Focus+ Context trees add automation for automatically choosing which portions of the tree to show at any instant. In this way, they reduce the time cost of navigating around the tree. Four main methods of expanding focus+context trees have been proposed. The first is logical filtering of nodes. Furnas (Furnas, 1981) describes a class of fisheye techniques in which nodes are automatically displayed or elided according to the user’s computed degree-of-interest (DOI) in them. The estimated
DOI of a node = Intrinsic
Importance + Distance from a focus node.
The Intrinsic Importance of a node is its distance from the root and the Distance of a node is the number of nodes that must be traversed by following parent and child links from the node of interest until reaching the subject node. Those nodes whose DOI lies below a certain threshold are not displayed. If the user indicates interest in some node, say by selecting it, this calculation is performed again and the display elides those nodes below threshold. In this way, the display of the tree follows the user’s changing interest. The problem with this technique is that there is no guarantee the displayed trees will fit in any display bounds. The technique is especially problematic when there are a large number of sibling nodes in a branch.
A second
class of focus+context techniques uses geometric distortion. An example is the hyperbolic tree(Lamping & Rao,
1994; Munzner & Burchard, 1995). A visual transfer function is defined that distorts space
such that the area of interest is magnified and at the
expense of nodes of the trees some distance from this interest. Selecting a node moves it to the center (or
side) of the display. Nodes further out
are smaller and closer to each other.
The display stays within fixed boundaries. But only a limited number of links out from the focus node can be
seen. This technique is less suited for
cases in which the DOI varies in discontinuous ways across the tree. There can be multiple foci in this
space. Another variant of geometrical
distortion is the cone-tree (Robertson, Mackinlay, and Card, (Robertson, Mackinlay,
& Card, 1991)). Cone-trees arrange the nodes in a 3-D
tree. Selecting a node rotates a branch
of the cone-tree, bringing related nodes into the foreground while sending
other nodes into the background. This
technique uses natural perspective to achieve some of the effect of geometric
distortion, but in a way that the user does not experience the geometric
compression as distortion. Furnas’
fisheye view technique can be combined with cone-trees, thus allowing the
display of larger trees on the order of 10,000 nodes (S. K. Card et al.,
1999). Because a cone tree is a 3-D display, some
of the nodes occlude each other.
Another possible class of technique for expanding focus+context displays is semantic zooming. As the display is zoomed in and nodes are expanded past a certain threshold their content changes. Fox and Perlin (Perlin & Fox, 1993) used this technique in their Pad system to expand a calendar, which can be seen as a sort of containment tree. Mackinlay et al (Mackinlay, Robertson, & DeLine, 1994) also used semantic zooming in calendars and other spiral trees. The tree is arranged in a 3D spiral. One node from the tree is expanded and its content semantically zoomed to reveal additional structure. The higher-level nodes are spiraled toward the center and made more distant from the user (using perspective to reduce their size). This tree layout has the virtue that it stays confined in fixed bounds, but the user only sees a limited subset of the nodes in the tree, essentially a view looking upward in the tree toward the root.
A final focus+context technique is to cluster nodes far from the point of focus. Nodes represent clusters of nodes. Those near the point of interest are expended into their constituent parts; those more distant are kept in an aggregate form. This technique was used in SemNet (Fairchild, Poltrock, & Furnas, 1988) and could be applied to trees.
DEGREE-OF-INTEREST TREE (DOI TREE) SOLUTION
Our
Degree-of-Interest Trees (DOI Trees) solution combines all four focus+context
techniques with a methods to ensure that the tree stays within
a predefined bounding box. DOI Trees combine
(a) an expanded computation of users’ DOI estimates with (b) logical filtering
to elide nodes of low DOI, (c) geometric scaling of node size according to DOI
so as to be able to hold different levels of information, (d) semantic scaling
of the contents of the nodes with node size, (e) clustered representation of
large unexpanded branches of the tree, and (f) animated transitions, designed
to speed the user’s rapid understanding of changes in the tree. New techniques are developed for many of
these parts.
Degree-of-Interest Computation
The degree of interest calculation is expanded beyond that used by Furnas. Whereas Furnas’s calculation assigns all siblings the same distance from the focus node and hence the same DOI value, our calculation treats the children of a parent node as ordered and assigns fractional DOI offsets to the children based on order distance from the focus node. The farther the sibling is from the focus node, the more the fractional decrement in its DOI (but the decrement is always less than 1). This allows the visualization part of the program to decide which sibling nodes to compress and how to compress them. Whenever the user clicks on a tree node, that node becomes the focus node, DOI values are recomputed for each node of the tree, the tree is laid out again, and an animated transition moves from one layout to the next. Focus nodes or even multi-foci can also be determined by values of the data or hits in a search.
Visualization of Tree
There are a
small number of possible node sizes (we currently use three main sizes). The largest size is sufficient to display
the entire full content of the node.
For an organization chart, this would include a person’s name, picture,
organization, title, extension, room number, web page, and possible other
information. A middle size node still displays
still enough information to identify a
person including a few facts about him.
A small node just displays the fact that a node exists in that position
and hence shows tree structure (and a mouse target for tree expansion). In addition, nodes have multiple faces to
allow the storing of additional information.
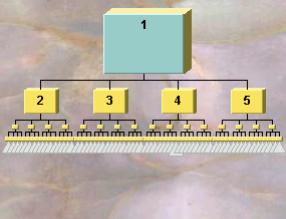
A table maps DOI values into node sizes. Figure 3
shows the display of the uniform tree in Figure
2 (with a branching factor of 4 at each node) when the focus is at the
root. A larger node has automatically
been selected for the focus node and its color changed. Smaller node sizes have been automatically
selected by the algorithm for nodes with lower DOI. Optionally, a small “fade value” is assigned to cause nodes
farther away that would be the same size to be a little smaller. This is equivalent to increasing the
weighting on the DOI distance function.
Figure 3. Display of
a uniform tree of 4 levels,
4 branches each level, focus on Node 1 (number in the figure represents the
node number).
In Figure 4, one of the nodes in Figure 3 (node 3) on the next level down has been selected, changing the DOI calculation for the nodes. Now when the tree is displayed, node 1 is reduced in size, node 3 is increased, and nodes below the focus tree are increased in size, according to the computed DOIs for the nodes. The transition proceeds by a smooth animation from one state to another to keep the user oriented and unconfused.
Figure 4. Same table with focus on Node 3.
In Figure 5 one of the lowest nodes has been selected, either by selecting directly, or by selecting nearby nodes, causing the target node to get larger and be more easily selectable.
Figure 5. Same tree expanded down to a leaf node.
UTILIZATION of the Space Resource
Space on the display is a resource. The tree needs to be constrained always to stay within its assigned resource. This requires methods for monitoring and making adjustments to the tree visualization. Often, to stay within its bounding box, the tree visualization must be compressed. But if the space is being under-utilized, the tree might also be profitably expanded to take advantage of the additional space. Both compression and expansion are controlled by the users’ estimated DOI for each node.
Compress to Fit
The fact that the basic DOI-based algorithm very greatly reduces the pressure on the space resource sets up the condition for algorithms that enforce space boundaries to be successful. There are two cases to consider: the tree not fitting in the X direction and the tree not fitting in the Y direction.
Compression in X. The tree not fitting
in the X direction is common and occurs either because of a large branching
factor below one node or else because there is an accumulation of widths across
several subtrees. In the latter case, the nodes below each
box are laid out in the horizontal space available for each box. This pattern is visible in Figure 6. The nodes with the highest DOIs in a row
have the largest node size. This node
size establishes the Y height of a region in which to lay out the immediate
descendents of a node. If there are too
many Y descendents horizontally, they are folded into multiple rows according
to a common organization chart convention (with a vertical line joining the
rows, see Figure 11). If the branching
factor of individual subtrees is large, then the nodes are overlapped as in Figure 6. If there are elided nodes below a threshold
DOI value, then a triangular symbol proportionate to the log of the number of
nodes is used.
Figure 6. Tree showing overlapping of large branching
factor of nodes under several nodes, when these have moderate DOI. There are 300 nodes under the triangular symbol.
To handle trees too wide for the bounding box, the box is divided horizontally into three regions (Figure 7): The regular free layout zone, a compression zone, and an aggregation zone. Typically 70% of the screen is in the free layout zone, with 30% in the combined compression and aggregation zones. If necessary, the horizontal layout will be compressed (as in row 3 of Figure 6) for some of the nodes by overlapping them. As the mouse is moved over these nodes, they spring to the front, overlapping their neighbors, thereby allowing the user to peruse them. Space in the compression and aggregation zones is allocated according to the fractional DOI value of each node. By default, the value gets smaller as the node gets closer to the edge of the display. With large numbers of nodes, multiple nodes may occupy the same display location. Only one of the nodes will be displayed. If that node is selected as the focus node, it will be shifted to the free layout zone and surrounding nodes will then be visible. The use of DOI to do selective expansion and the use of folding rows greatly increases the size of tree that can be horizontally laid out. The use of compression and aggregation zones ensures that all trees can be fit within the space.
Figure 7.
Compression and aggregation zones.
Compression in Y. It can also happen
that a tree would be too deep vertically to fit within its space. Normally the tree is then scaled to fit within the
Y dimension. If the scaling would result in nodes that are too small to display their contents, In
this case, nodes are either elided lower in the
tree or at the top, depending on the DOI and the position of the node of interest. First, if the nodes for a tree are less than
a threshold DOI, then they are elided and replaced by an elision graphic,
essentially representing the nodes as a cluster. Since nodes decrease intrinsic importance with distance from the
root and in distance importance with distance from the focus node(s), the chain
of nodes from the focus node through successive parent nodes to the root will
have the same DOI value except that the fade feature will gradually make the
nodes smaller as they approach the root node. Since the tree is scaled to fit
within the window, this could cause all of the nodes to become very small for
very deep trees. To deal with this problem a top portion of the tree is removed
and replaced with an elision graphic.
Expand to Fit
Sometimes the algorithms described so far might leave extra blank space on the display below the focus node. Therefore, an alternative version of the algorithm, switch selectable by the user, expands part of the tree into this space. The way it does this is that if there is still vertical space available on the display, the “most interesting node” is expanded.
This could (1) be the node with the highest DOI on the row, or it could (2) be the node with the largest number of descendents, or (3) it could be the node with the highest “information scent” as determined by key words typed by the user or (4) the words of greatest frequency in the nodes selected or (5) by other means. Figure 8(b) shows the tree of Figure 8(a) expanded according to the subtree with the most nodes.

(a) (b)
Figure 8. (a) Tree from Figure 1 without Expand to Fit turned on. (b) Same tree with Expand to Fit expanding the node with the most subnodes.
Within-Node Compress to Fit—Semantic Zooming
Each node also represents an assigned space resource within which there are items to display. In our example organization chart application, these fields include attributes such as post name, post reported to, name, title, office extension, email, picture file URL, and home page URL. Just as we used compress-to-fit techniques for the layout, we can also use semantic zooming compress-to-fit techniques within the node:
1. Data deletion. Smaller nodes only display some of the data items.
2. Word abbreviation. Words and phrases are abbreviated if there is not room on the line where they are displayed. For example, Vice President becomes V.P. The system uses a text file of abbreviations plus some heuristics to generate abbreviations. Figure 9 shows the DOI Tree of an organization chart with the green node selected. The effect of data deletion and word abbreviations on the middle-sized nodes can be seen.
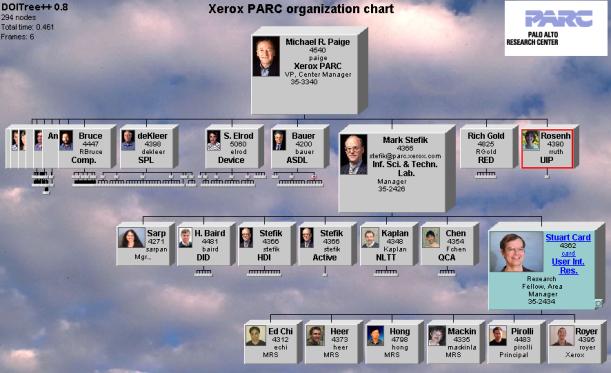
Figure 9. Organization chart with over 400 nodes accessible over WWW through Web browser.
3. Node rotation. The normal view of nodes shows them as 3D boxes. The 3D property is meant to suggest that the boxes have alternative faces. Stroking a box (by dragging the mouse horizontally over a box) makes the box appear to rotate such that another side of the box faces forward. This allows more data items to be associated with a node that are quickly accessible. Figure 10 shows the rotation of the nodes. Figure 10(a) shows a frame in mid-rotation; Figure 10(b) shows the completed rotation. In the figure, the picture has been expanded to fill the whole node side, to serve as a better cue—another form of semantic zooming. There are optimally three faces to a node—front, left, and right (more would be confusing).
Figure 10. Node rotation. (a) One of the animation states during node rotation after the user has right-stroked the box. (b) After rotation—another face of the nodes is facing forward. Side faces of the nodes can be used to store subsidiary node information, thus expanding the amount of information that can be associated with a node.
Tree Transitions
User
orientation in the tree is preserved by making the views of the tree animate
into each other. The animation time is
set at a desirable level, usually in the range of (0.5~1.0 sec) (see (Stuart K. Card, Moran, & Newell, 1986)). The average draw time per frame for recent frames is used to set
the number of animation frames that can be drawn in this time. The in-between frames show a linear change in each
node’s
size and position. This is used to calculate the in-between positions
of the boxes. It is
important that the choreography of animated transitions be understandable by
the user. In fact, the necessity for simple-to-understand
transitions was found to limit tree layouts.
For example, Figure
11 employs a folding convention often used in organization
charts. Implementation of similar
layouts convinced us that it is difficult to make tree transition animations
with such layouts that are understandable to the user, except in the case where
the stacked rows are of the smallest size nodes (e.g., as in Figure 6). Rapid-to-understand transitions are very
important, because in focus+context displays we use system dynamics to
substitute for being able to show the entire tree. The user must have the experience that there is a single tree
that is being stretched and pulled.

Figure 11. Organization chart showing folding convention. This tree layout is more difficult for producing understandable animated transitions for the user.
SEARCH AND MULTIFOCAL DOI TREES
DOI calculations can be done based on computations other than the user’s point of attention used above. An example is a user searching over a collection. This often results in multiple initial focal points from which to start the DOI calculation. The interest in a given node may be composed of DOI generated from multiple sources. In Figure 12, the user has searched for the name Stefik in the organization chart. The result reveals that Stefik appears three times and reports to himself twice. The chart shows these nodes, but it also shows them in context to the rest of the organization chart. The visualization makes it easy to find answers to questions like “to whom does Stefik report?” or “who is the lone person reporting to Stefik in one of his capacities?” or “who are all the research fellows and how are they distributed across laboratories?”
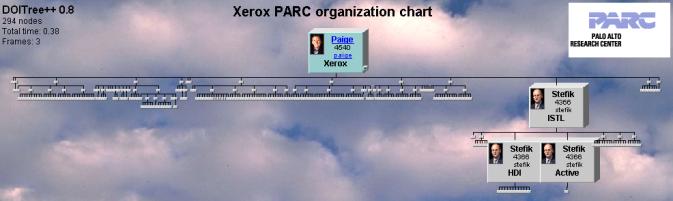
Figure 12. Multi-focal result of a search. Besides showing the search hits, the tree context for the hits is also shown.
USES OF DOI TREES
DOI Trees have many uses. Here we list just a few:
Information Browser. Items in the tree could be linked to arbitrary URL pages or to programs, such as an email program. Hence, the tree could act as a browser across pages of WWW data. For some applications, such as the organization chart, the tree as a browser operates more quickly than a conventional WWW browser page. This is because a group of the pages can be on the screen together in their relationship.
Organization Chart. This is the application we have used as an example. In addition to displaying the organization chart and its use in finding people in the organization, the URL links on the nodes of the tree also serve as gateways to supporting data (Figure 9). This chart has over 400 nodes, is accessible over the Web, and combines all the information contained in ten separate organization charts (each of which fills a page). By searching for a name or by browsing the chart, the details of the individual organizations are revealed. Furthermore, the chart serves as a gateway into the organizational home pages of the different organizations (accessed by clicking the appropriate link within the node) or personal home pages. It also could be used to access email to any of the individuals whose email is given on the chart by simply clicking the link.
Web site visualization. Another use is for views of Web sites, which have been coerced into tree form (Figure 13). Thumbnail miniatures of pages could be displayed in the nodes. Full size displays of the pages could be displayed beside the browser.
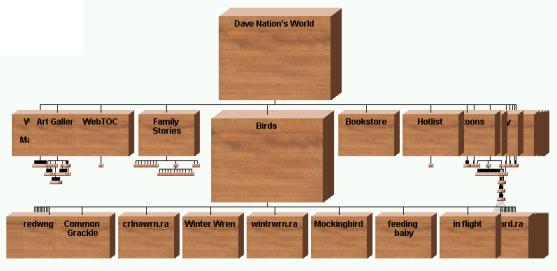
Figure 13. Visualization of Dave Nation’s World website. Nodes expand and contract as user browses or searches website.
Web site statistics. The DOI of individual pages in the web site could be set to a function of the number of hits that page has received in the last month or week or hour or other time period. Thus, site sponsors could watch the activity of their web sites.
Databases. Data bases that are
expressible by trees could be displayed and searched. For example, the 7000-node taxonomic database used for
competitive tests at CHI is shown in Figure
14. By following the higher
level groupings, the user has found the node “Ebola Virus”.
Multilinked databases. Many databases that are not trees can also be displayed as DOI Trees. An example of such a database is given in Figure 15. The database is coerced into a tree. Additional, non-tree links are revealed as blue lines (as in the figure) when the mouse is moved over them. Because of the mapping into the tree, some nodes may be duplicated in the structure (these are colored pink in the figure). By using these techniques, complex structures that would be difficult to plot as generalized graphs are plotted as trees, but the other linkages can still be investigated.
Figure 14. 7000-node taxonomic database. User has found the item Ebola.
Figure 15. Tree derived from database with multiple links per node. One link type is used to form the tree. Others are visible when the mouse is placed atop them. (Node faces have had proprietary data removed).
Email streams visualization. Email streams coul- d be
represented as trees. The DOI for these
streams could be generated based on the content similarity and tree closeness.
DATA SOURCE AND AUTHORING
The data for DOI Trees can be derived from a database. They can also be read from tab-delimited files. Users can thus prepare and edit trees for DOI Tree display by using normal spreadsheets without any programming. The present embodiment of DOI Trees enables users to place arbitrary bitmaps as backgrounds to the tree and to the nodes. This allows the display of these trees to be readily adapted to presentation requirements of an organization.
DISCUSSION
The evaluation of dynamic visualizations such as DOI Trees is a subtle undertaking. Philosophically, we do not believe it is sufficient to do a simple system A vs. system B human factors evaluation on DOI Trees, because the results may depend on the task, the contents of the nodes, and perceptual properties of the visualization design, all of which need to be teased out. Our previous studies on the hyperbolic tree required lengthy studies using eye-movements and scales of semantic ambiguity (measured as information scent) in order to tease out issues of visualization design (Peter Pirolli, Card, & Van Der Wege, 2001, in review) and visual attention (P. Pirolli, Card, & Van Der Wege, 2000). We plan similar studies for DOI Trees, but they are beyond the scope of this paper. What we can say is that the current prototype is in use for organizational charts at PARC and in use for other databases in the government. Users seem to be able to use it easily. Several government agencies in the health and statistical services area have indicated interest. When we contacted the Xerox licensing office for licensing discussions on this system, we were amazed that they had already discovered it on the internal corporate Web and were already using it for their own applications. Thus, we believe it will not be hard to use the system for practical applications.
DOI Trees use predictions of the user’s dynamically changing interest in the information and context of nodes in a tree to change the display. Nodes of most interest are filtered for visualization, geometrically enlarged, semantically zoomed, and shown in tree context of relevantly selected other nodes. Nodes predicted to be distant from the user’s interest are shrunk, aggregated, or elided. Nodes in the display become the access portal to related information on the web or applications like email. DOI trees force the display to be contained within a constrained space, but they also choose extra nodes to display in order to fill that display.
These
design features are in the service of higher-level goals. The principle goal is to reduce the average
cost-structure of information to the user of a large information set. The DOI calculation and its subsequent use
in visualization attempts to reduce the cost structure of the task using the
information. For example, in Figure 12 the cost in time
for finding who Stefik reports to or who reports to him in his many capacities
is low. This is partly done by making
user access to many of the other reporting relationships in the tree a little
slower. That is to say, the DOI
calculation is used to bias the
interface in a way that accelerates likely actions. This differential cost of accessing different information is what
we mean by a cost structure and the paradigm of an attention-reactive user
interfaces seeks to dynamically change these
biases according to where the user’s attention is (or should be—this paradigm
can also be used to direct the user’s attention to areas the system thinks are
important). Notice that Aalthough
there is an access bias, notice the fact that DOI Trees still maintain
an overview of the entire field of information, maintaining context and at
least a minimum access to all pieces of information.
The second goal is to increase modularity between the DOI and the visual components by limiting the information exchanged between the DOI calculation and the visualization to a narrow interface. It should be possible to change either the DOI or visual component more or less independently Hence DOI Trees should make a good system building block.
The third goal is spatial modularity. By making the DOI Tree stay within its space bounds (which could be dynamically increased or decreased), it is easy to compose this display with other displays (for example, a panel showing detailed information about the current focus node). Thus, it would be easy to use this focus + context display as the overview part of a larger overview + detail display. These last two goals make DOI Trees a modular system component to use in the construction of attention-reactive user interfaces for systems involving access to or sensemaking of large collections of information.
ACKNOWLEDGMENTS
Jeff Heer from Xerox PARC and Debbie Roberts from NSA contributed code to the algorithms.
REFERENCES
Bertin, J. (1967/1983). Semiology of graphics: Diagrams, networks, maps (W. J. Berg, Trans.). Madison, WI: University of Wisconsin Press.
Card, S. K., Mackinlay, J. D., & Shneiderman, B. (1999). Readings in information visualization: Using vision to think. San Francisco, California: Morgan-Kaufmann.
Card, S. K., Moran, T. P., & Newell, A. (1986). The model human processor: An engineering model of human performance. In K. K. L. Boff & J. Thomas (Eds.), Handbook of perception and human performance (pp. Chapter 45, 41- 35). New York, New York: John Wiley and Sons.
di Battista, G., Eades, P., Tamassia, R., & Tollis, I. G. (1999). Graph drawing: Algorithms for the visualization of graphs. Upper Saddle River, NJ: Prentice Hall.
Engelbart, D. C., & English, W. K. (1968). A research center for augmenting human intellect. Paper presented at the Proceedings of AFIPS'68.
Fairchild, K. M., Poltrock, S. E., & Furnas, G. W. (1988). Semnet: Three-dimensional representations of large knowledge bases. In R. Guindon (Ed.), Cognitive science and its applications for human-computer interaction (pp. 201–233). Hillsdale, New Jersey: Lawrence Erlbaum Associates.
Furnas, G. W. (1981). The fisheye view: A new look at structured files. In S. K. Card, J. D. Mackinlay & B. Shneiderman (Eds.), Readings in information visualization: Using vision to think (pp. 312-330). San Francisco: Morgan Kaufmann Publishers, Inc.
Herman, I., Melancon, G., & Marshall, M. S. (2000). Graph visualization and navigation in information visualization: A survey. IEEE Transactions on Visualization and Computer Graphics, 6(1), 24-43.
Johnson, B., & Shneiderman, B. (1991). Space-filling approach to the visualization of hierarchical information structures. In Proceedings of ieee visualization '91 (pp. 284–291).
Lamping, J., & Rao, R. (1994). Laying out and visualizing large trees using a hyperbolic space. Paper presented at the UIST'94, ACM Symposium on User Interface Software and Technology.
Mackinlay, J. D., Robertson, G. G., & DeLine, R. (1994). Developing calendar visualizers for the information visualizer. Paper presented at the UIST'94, ACM Symposium on User Interface Software and Technology, Marina del Rey, Ca.
Munzner, T., & Burchard, P. (1995, December 14-15, 1995). Visualizing the structure of the world wide web in 3d hyperbolic space. Paper presented at the VRML '95.
Perlin, K., & Fox, D. (1993). Pad: An alternative approach to the computer interface. Paper presented at the SIGGRAPH'93, ACM Conference on Computer Graphics.
Pirolli, P., Card, S. K., & Van Der Wege, M. M. (2000, May, 2000). The effect of information scent on searching information visualizations of large tree structures. Paper presented at the AVI '2000, Palermo, Italy.
Pirolli, P., Card, S. K., & Van Der Wege, M. M. (2001). Visual information foraging in a focus+context visualization. Paper presented at the CHI 2001, Seattle.
Pirolli, P., Card, S. K., & Van Der Wege, M. M. (in review). Effects of information scent and information density on the hyperbolic tree browser.
Reingold, E. M., & Tilford, J. S. (1981). Tidier drawings of trees. IEEE Transactions of Software Engineering, SE-7(2), 21-28.
Robertson, G. G., Mackinlay, J. D., & Card, S. K. (1991). Cone trees: Animated 3d visualizations of hierarchical information. Paper presented at the CHI'91, ACM Conference on Human Factors in Computing Systems, New York.
Russell, D. M., Stefik, M. J., Pirolli, P., & Card, S. K. (1993). The cost structure of sensemaking. Paper presented at the INTERCHI'93, ACM Conference on Human Factors in Computing Systems, Amsterdam.
Shneiderman, B., & Wattenberg, M. (2001). Ordered treemap layouts. Paper presented at the IEEE Symposium on Information Visualization.